Except for the environmentally-educated circle, the term carbon or carbon footprint is not that clear among the public. The common populace still struggles to comprehend what carbon footprints are all about. Most of our common public is well confused to the core of it. I have seen people misconstruing the term to their own convenience. I had a recent chance to overhear a short conversation on carbon footprint in a restaurant.
“Do you have any idea of what a carbon footprint is? I tried asking this question to a few people, including my supervisor. They are also not so clear of what it really is’ the guy told his friend sipping coffee.
‘Neither do I, but I presume it’s something related to the old style of taking copies using the dark carbon papers’ was the doubtfully presumed answer from the other guy.
Table of Contents
What is carbon footprint?
All of our activities cause us to release carbon dioxide, the major gas blamed for global warming or, in simple terms, earth heating. This carbon dioxide emission process continues from the activities we carry out from morning to night every day. Even when we brush our teeth, some amount of carbon dioxide is released. It doesn’t mean that the CO2 is leaving directly from the brushing activity. The water we spend comes to our tap after guzzling some electricity. The electricity is generated by burning some coal or gas. The burning process lets the smoke rise up into the sky. The major portion of the smoke mixture is CO2. Thus, any of our action results in releasing some emission of CO2. Some activities release the gas directly, while most others do it indirectly. Brushing teeth here is an indirect emission activity.
Then, what is examples of direct emission activity?
For example, we can say CO2 is a direct emission of cooking. Every home has a kitchen. Any kitchen is mostly used for cooking. Almost all cooking activities are done using Liquid Petroleum Gas (LPG). This burning process emits CO2 that is sucked by hoods or chimneys and sent out into the sky. Imagine the number of household kitchens in your township, then in the entire country and then in the entire world. The world has more than 7 billion people. Of them, many households use LPG for cooking. The rest use firewood, which is also an activity releasing CO2 directly.
Other examples are the vehicles on the roads. The vehicles make direct emissions from their tail pipes. One normal car releases more or less 120 gm of CO2 per km. The average mileage of a car per year is 12,000. There were 700 million cars in 2006 in the world. The number of cars worldwide is expected to rise to 1.25 billion in 2025. Nearly 3000 cars are used on our roads every day. Just calculate how much CO2 is loaded up into the sky by cars alone!
The carbon load in the sky
Atmosphere is the space above the earth’s surface. There are layers in the atmosphere with no definite borders. CO2 and several other gases go into this space and hover around producing harmful effects. They build up there day by day. They can’t find a way to get out into space so they get trapped in between. This condition renders some variations in the climates of the earth. The change brings extremes in temperature that result in natural disasters like storms, heat waves, floods, and droughts. We generally call it Global Warming effects.
In the years around 1910, the volume of CO2 in the atmosphere was 740 billion tons. The same volume increased to 780 billion tons in 1990. The increase is caused by both natural and human activities. Natural load of CO2 comes from volcanic eruptions, forest fires, etc. Human-caused load comes from power generation, industrial and farming activities, vehicles and open burnings.
Carbon dioxide in the air is calculated based on particles per million (ppm). Currently, the volume of CO2 in the air is 392 ppm and it was far less than that some six decades back. In proportion, this amount can be said 0.0392%. The progressive increase is rated at 2.0 ppm a year.
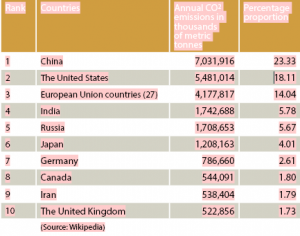
The following table lists the top ten countries emitting the CO2/annum:
Percapita carbon footprint
Everyone in the world is responsible for the CO2 load in the sky. Some countries contribute greater quota than others. For example, everyone in the US is emitting an average of 21.2 tons of CO2 a year. In Malaysia, each of us releases an average of 7.3 tons a year. The world average stands at 4 tons a year/head.
The above calculation is the average in the gross total emission of the entire country based on certain bulk emission activities.
Basics of carbon footprint calculations
Everybody is responsible for certain amount of carbon emission. One cannot say he is free from emitting any CO2. Even his/her breathing activities emits CO2. The meals eaten by a person in a day releases about 1.25 kg of CO2. The eater may wonder if eating too causes some CO2 emission. Of course, eating is not a direct cause. But the stuff brought to cook the food and the energy consumed has a volume in terms of releasing CO2. A person may not have a car to drive. But, he or she still uses a public transport system to travel. Traveling in a city bus releases about 186 gm of CO2 per mile.
Consuming one kWh power emits about 1 kg of CO2. Your electricity bill tells how much power your household or office consumes every month. Just look at the figure in your electricity bill and calculate how much CO2 rises into the sky each month due to your own consumption.
One kg of LPG (Liquid Petroleum Gas) releases about 3 kg of CO2. Therefore, none of our activities is free from any release of CO2. Surviving everyday causes us to emit CO2, either directly or indirectly.
Personal carbon footprint
For a rough calculation of individual or personal carbon footprint, you can refer to the following basics into consideration.
Power consumption
Divide the total kWh in a year by number of households and keep your share for adding
Gas (cooking)
Divide the annual consumption of cooking gas and divide by the number of households
Transport
Find the distance traveled for the entire year by different kinds of vehicles like in conventional cars, large car, small car, city bus, express bus, trains and LRTs. Calculate the volume of CO2 based on the type of transport system and distance traveled.
If you have traveled by air, add in the volume for each km flown. Refer to the relevant website where you can get an idea on the scale of CO2 release per km.
Meals
Add CO2 for meals eaten at the rate of 1.25 kg per day for the whole year.
Add on to reach an aggregate total that tells your personal carbon footprint. Remember it may not be so accurate. However, it gives you an idea of how much CO2 goes to the air by your individual survival.
Corporate carbon footprint
With some slight modifications, one can roughly find out the corporate carbon footprint. Here, you may have to add additional CO2 release volume for each vehicle in the fleet of your company.
Apart from the above, office space, shipment of things, number of employees, total travel, hotel accommodation, parties & functions, air travel, etc do hold their own share. Each of these activities has its own basic calculation. With a few divisions and multiplications, you can arrive at the final footprint volume. Compare it to the minimums and optimums of other individuals or companies. See your own standing and justify the results. If you are already following some green practices like trees planting, recycling, etc, you may deduct certain tons from the total emission.
Now, you know where you are. If you think you are in a worrisome point, just find ways to cut the footprint as much as possible. Scrutinize where you can by bringing the emission down.
Some tips to bring down carbon footprint
Power
- Have a power audit and see where you can control the consumption of power. Refitting energy-efficient appliances is a good option. Though it causes us to commit slightly more in terms of money initially, it may save us a lot in the long run.
- Fix individual meters for each section and advise the excess consuming area to cut down.
- Fit solar panels and harvest sun energy
- Green the interior that would save energy spent in cooling
Transport
- Reward those commuting to office by giving some day-offs and lunch coupons.
- Introduce a no-driving day at least twice a month.
- Avoid overseas meetings and alternate it with video conferencing instead
- Avoid air travel, unless it is absolutely necessary
- Stop giving car allowance and introduce travel allowance
- Allow appropriate staff to stay home and work as and when necessary
Water conservation
- Refit water taps with efficient water saving plumbing system
- Harvest rainwater and modify to reversible plumbing system
Packing and shipment
- Find a way to make light packing for shipment
- Plan deliveries and collection the economic way
- Recycle and waste management
- Recycle whatever and wherever is possible
- Reduce waste as and where applicable
Tree planting
- Make it a practice to support tree planting every year
Carbon food-print
- Advise members of your family or workers in your company to go for local foods reducing carbon food-print
- You can do something more than the tips given above. Be creative. For instance, if you travel outstation, you may prefer to rent a hybrid car instead of your normal sedan. You can also look for some green hotels.
Remember any of your activities loads up CO2. The same way, any of your eco-friendly activities helps in reducing the CO2 load. Just looking at any activity in a ‘green’ angle helps to curtail the load.